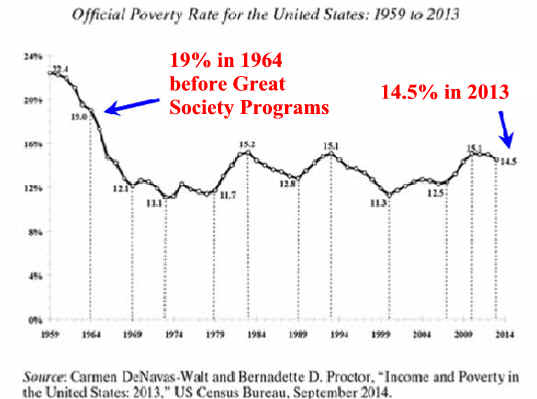
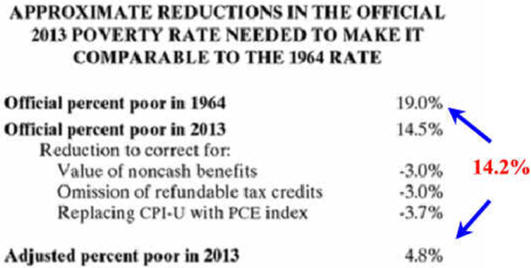
This
chart "...provides a first approximation of how correcting the 2013
poverty rate for noncash food and housing benefits, refundable tax
credits, and not using the upward [inflation] bias of the CPI-U
would change the 2013 poverty rate. This adjusted poverty rate falls from
14.5 to 4.8 percent, making the 2013 rate roughly a quarter of the 1964 rate
(19.0 percent). If we were to lower the poverty threshold for cohabiting
couples to match that for married couples the 2013 poverty rate would have
fallen even more."
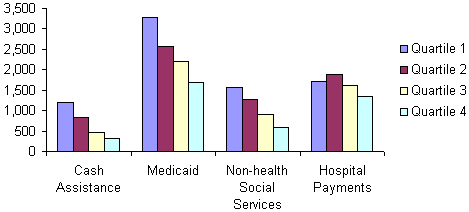
Examples of noncash benefits include food stamps
SNAP), discounted school lunches, subsidized rent, Medicaid, and Medicare.
See
Source
Editors
Comments are in red.
Growing up in a rural 1950's Massachusetts I
observed
Retiring in rural 2003
Central Florida I observed
Condition
Position
Condition
Position
Elderly lived with their
children, few had health insurance or much income Poor Families lived in older house at the end of dirt roads Poor Children were skinny, often dirty, didn't finish HS,
pooped around and then went into military, found a trade or pumped gas
Bottom 20%
dropping to
bottom 15%
Elderly live on their own
with Medicare Poor families lived in older lowland house or trailers Poor Children, obesity a problem, most finish HS, try college,
go into one of many services industries and live at home.
Stuck at 15% as Government Help
is Ignores by many Liberals and
Despised by many Conservatives.
Are Medicare and
Medicaid
Part of the Welfare System?
Social
insurance Taxes - SS + Medicare
=
deep doo-doo
Liars, Dame Liars
and Statisticians
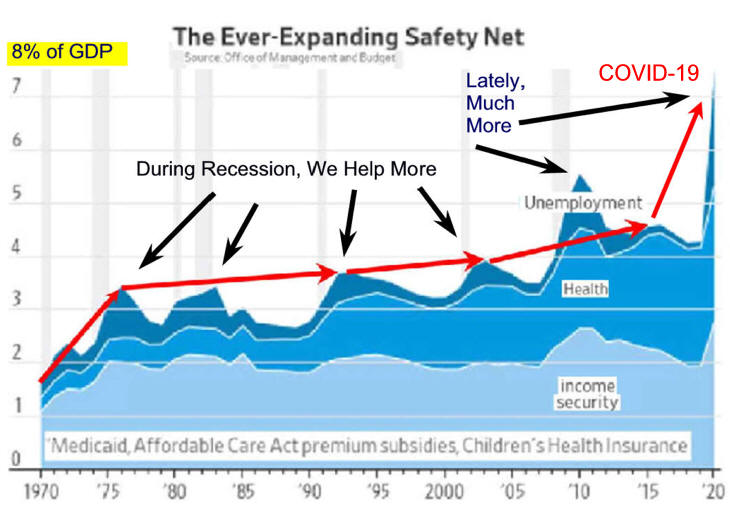
This data shows
a tremendous increase in our safety net spending but there are two
problems. Total spending is not adjusted for inflation which has been
was very high in the 1970's and high the rest of the century. Also using
appropriate techniques shown above yields a drop in poverty to 4.8%.
More
Relevant Question is
why isn't the CBO providing
and publicizing basic data using appropriate methods to
judge specific issues. The CPI-U
is an all-purpose index that is very often updated but it is inap-
propriately
for long-term comparisons. Instead liberals use one set of data and
conservatives use another set of data. Both are true but do not
communicate the truth.
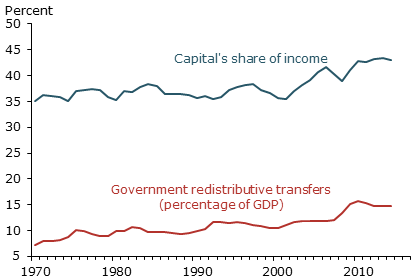
...shows that government transfer payments to
individuals approximately doubled, rising from about 7% of GDP in 1970
to nearly 15% in 2014. These transfer payments primarily redistribute
income through various social programs, including disability and
unemployment insurance, Medicare and Medicaid, and food stamps. As such,
these transfers should disproportionately benefit households in the
bottom 80% of the income distribution."
Rising Income Inequality
Editors Note:
I am really annoyed at those on either side of an issue that should know which
statistics are misleading but are interested in personal gain. Human prejudice for a particular idea
causes many to easily accept any data that supports their prejudice. Example is
education. Many use the average income of those with a Bachelor's degree
as a reason of everyone going to college when the much lower median
income of those with just a
bachelor's degree is much more
meaningful when considering college for everyone. In addition, STEM
majors have always had the highest economic investment return but only
recently has this fact been getting publicity.
Please e-mail suggestions to
antonw@ix.netcom.com
Another Relevant Question
What if people reporting all these people
especially children who are supposedly staving are basing there numbers
on the official rate that does not include food stamps and help paying
for school lunches? Do you think they do it so you will
donate to their nonprofit program to help the poor? To get elected? Have
you ever checked out salaries at guidestar.org.